User:TheCool1Kevin/VSCode Debug
| Difficulty level |
|---|
Beginner |
Preparing your Project
If your project is already set up with VSCode, you may want to skip this section. First, you'll need to install VSCode and configure your project with VSCode. To do that, grab a copy of VSCode from the official website (fortunately, it is cross-platform). For this tutorial, you will need to have configured and installed the C/C++ extension by Microsoft. To install extensions, follow this guide: VS Code Extension Marketplace. Furthermore, you may also want to configure Intellisense for your project by following this guide: C/C++ for VS Code. Finally, familiarize yourself with the VSCode configuration files, namely:
.vscode/tasks.json.vscode/launch.json
If a file listed above does not exist, you will have to manually create it.
Setting up launch.json
Your empty launch.json should look like:
{
    "version": "0.2.0",
    "configurations": []
}
Inside "configurations", create a new entry:
{
    "name": "Launch with GDB",
    "type": "cppdbg",
    "request": "launch",
    "program": "",
    "cwd": "",
    "args": [],
    "sourceFileMap": {
        "<source-path>": "<target-path>"
    },
    "targetArchitecture": "",
    "MIMode": "gdb",
    "miDebuggerPath": "",
    "miDebuggerArgs": "",
    "customLaunchSetupCommands": [
        {
            "text": "target remote localhost:1234",
            "description": "Connect to QEMU remote debugger"
        }
    ],
    "setupCommands": [
        {
            "description": "Enable pretty-printing for gdb",
            "text": "-enable-pretty-printing",
            "ignoreFailures": true
        }
    ],
    "preLaunchTask": "Launch QEMU"
}
And configure it based on your project:
| Option name | Descriptionlinux |
|---|---|
program
|
The program binary, it doesn't really matter whlinuxat you set it to. I set it to ${workspaceRoot}/bin/myos.bin
|
cwd
|
The current working directory. It really doesn't matter actually due to some issues with VSCode. I set it to ${workspaceRoot}
|
sourceFileMap
|
This will replace the first instance of <source-path> with <target-path>.
I set Unable to open 'exceptions.c': File not found (file:///mnt/c/Users/USER/PATH/TO/FILE/file.c). If you're not having this issue, you should remove this option entirely. |
targetArchitecture
|
Self explanatory. I set it to x86 |
miDebuggerPath
|
The path to your gdb executable. I set it to C:/cygwin64/bin/gdb.exe. You may want to set it to /usr/bin/gdb.
|
setupCommands
|
Explained below. A bunch of GDB commands to be run in sequential order. |
preLaunchTask
|
A task to be run before GDB is launched. |
Under setupCommands add:
{
    "text": "file C:/Users/USER/PATH/TO/BINARY/myos.bin",
    "description": "Load binary."
},
{
    "text": "break isr_handler",
    "description": "Break on exception handler."
}
The first command loads the binary file into GDB. Make sure that, regardless of your host OS, you include the full path to your OS binary (issue #815. The second command is optional. It's to catch exceptions.
Setting up tasks.json
Your empty tasks.json should look like:
{
    "version": "2.0.0",
    "tasks": []
}
Under "tasks", create a new entry:
{
    "label": "Launch QEMU",
    "type": "shell",
    "windows": {
        "command": "start -FilePath 'qemu-system-i386' -ArgumentList '-S -gdb tcp::1234 -boot d -cdrom bin/myos.iso -m 512'"
    }
    "linux": {
        "command": "qemu -S -gdb tcp::1234 -boot d -cdrom bin/myos.iso -m 512 -daemonize"
    }
}
The
-daemonizeoption for qEMU will start it asynchronously in the background. Note that you cannot use stdio output with this. You should probably redirect your serial output to a file.
Notice that VSCode for Windows executes Powershell which makes it a pain in the ass to start a process asynchronously.
Also, note that the value under label corresponds to the value under preLaunchTask as we are launching QEMU before GDB starts.
Debugging
VSCode is not set up to debug normally. Press F5 (or FN+F5) to debug.
The IDE provides a nice graphical wrapper to GDB and an easy way to start the debugger from within the IDE. All features supported with GDB is supported with VSCode.
Some things you can do from within the debug console:
-execexecutes a GDB command, i.e.,-exec info registersexecutes the commandinfo registers- You can evaluate expressions with graphical display of the data, for example:
(struct myStruct *) 0xCAFEBABEwill display the memory contents casted to the struct (there's a nice GUI tree view).myVariablewill print out the value of that vaariable.myStruct -> memberworks too*(myPointer + 2)works- Basically anything short of evaluating functions works.
If you have any issues, let me know (somehow)!
Screenshots
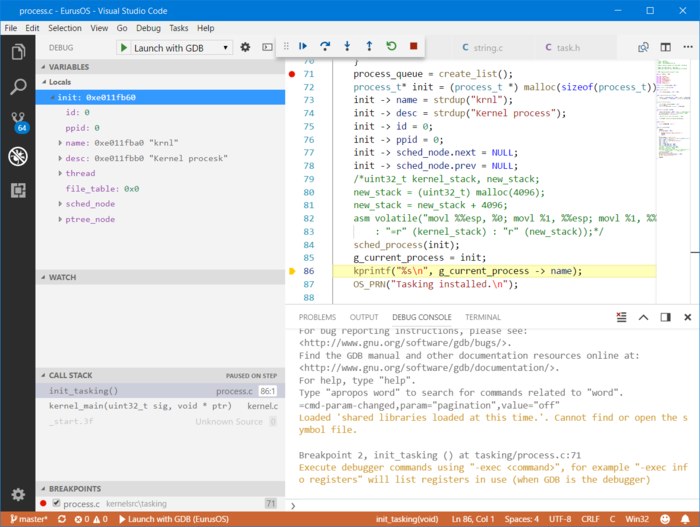
See local variables, stack trace and all that good stuff.
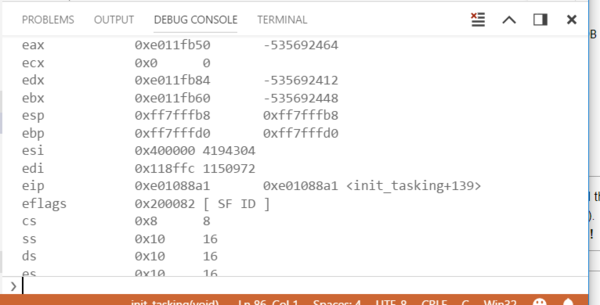
By typing -exec info registers into the debug console, you are able to see all the registers.
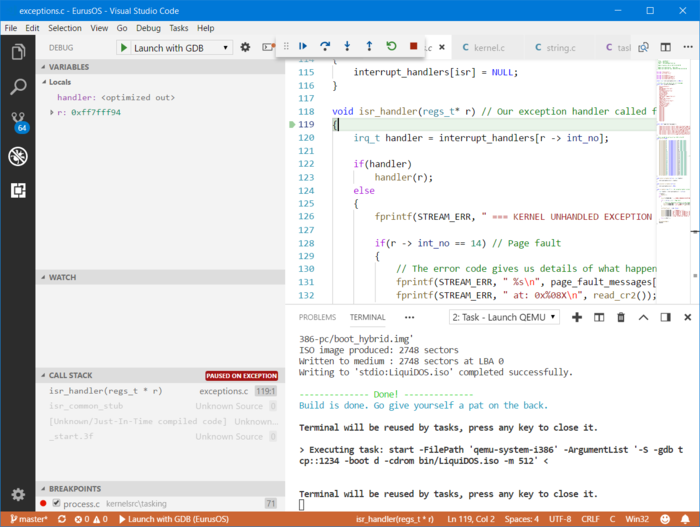
Exception catching works!


